아래는 Excel 2003에서의 메뉴다.
Excel 2007에서는 메뉴가 약간 달라져서 첨언..
Excel 2007 좌측 상단 동그란 버튼-Excel 옵션-'리본 메뉴에 개발 도구 탭 표시' 체크- 확인
하면 개발도구 탭이 생긴다.
Excel 2007은 개발 도구 탭에 XML 관련 메뉴들이 있다.
--------------------------------------------------------------------------------------------
메모장을 활용한 엑셀 데이터 시트를 xml로 출력 하기!!
일단 엑셀에 입력된 데이터 시트를 xml로 출력 하기 위해서는 맵핑이라는 작업을 해야합니다.
여기서 맵핑이란.. 제가 알기로는 데이터를 어떠한 방식으로 출력 할 것인지에 대한 규칙적인
형식이라고 해야하나 -_-;; 암튼 일단 출력할 엑셀 데이터 시트를 보겠습니다.
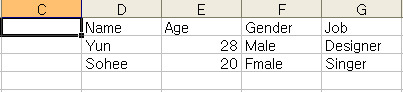
위 사진은 엑셀에 작성된 데이터들인데 맨 위가 필드 항목(속성이 되겠죠)들이고
그 아래에는 해당 속성의 값들이 되겠습니다.
자 이제 그럼 이 데이터들을 어떻게 맵핑 하느냐!!
일단 메모장을 열어서 아래와 같이 데이터를 입력 하시면 됩니다.
-----------------------------------------------------------
<test>
<Player>
<Name>1</Name>
<Age>1</Age>
<Gender>1</Gender>
<Jop>1</Jop>
</Player>
<Player>
<Name>2</Name>
<Age>2</Age>
<Gender>2</Gender>
<Jop>2</Jop>
</Player>
</test>
-----------------------------------------------------------
Html 처럼 각각의 태그 문장을 작성하면 되는데
<test> 이 부분은 xml의 노드 명칭을 작성하는 부분이 되겠습니다.
그리고 <Player> <Name>등 각 필드의 명을 작성하고 태그가 닫히는 사이에 아무 값을 넣어줍니다.
숫자를 넣으셔도 되고 문자를 넣으셔도 됩니다. (아무 데이터가 없을 경우 맵핑이 안됩니다.)
여기서 <test>태그 안에 다른 태그들을 중복으로 넣은 이유는 저 속성들이 여러개가 뽑힐 수 있기
때문에 중복적인 데이터 형식을 갖추기 위해 입력했습니다.
1개씩만 하면 나중에 맵핑이 제대로 안됩니다. 그러므로 꼭.. 최소 2개는 반복적으로 적어주세요.
작성을 완료 하신 후에 저장을 하는데 저장 하실 때 <다른 이름으로 저장>을 하셔서
아래 항목을 보시면 인코딩 방식이 있는데 꼭 UTF-8로 해 주십시오.
그래야 한글이든 영어든 안깨지고 잘 나옵니다 @_@;;
파일 형식은 TXT로 하되 파일 이름에 TEST.XML로 하시면 XML형태로 데이터가 저장 됩니다.
이렇게 메모장으로 내용을 작성하고 저장 한 후에 다시 엑셀로 돌아 갑니다.
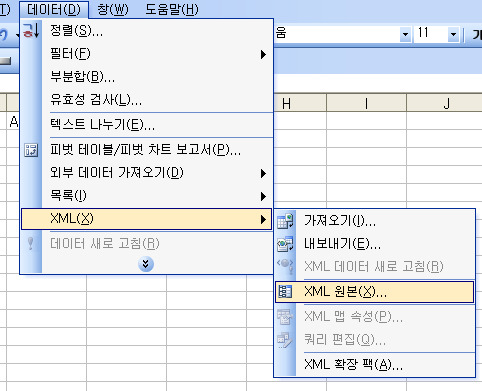
xml 형식으로 메모장에서 데이터를 저장 하고 난 뒤 엑셀의 메뉴에서
데이터>xml>xml원본 항목을 클릭 합니다.
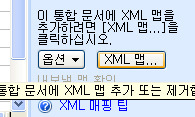
XML원본을 클릭하시게 되면 엑셀 우측 하단에 위와 같은 메뉴가 출력 되겠습니다.
메뉴 중 XML 맵.. 이라는 메뉴를 클릭 하시면 아래와 같은 그림이 출력 됩니다.
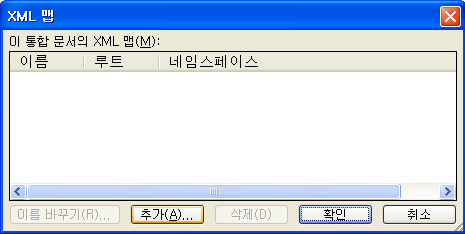
메뉴를 보시면 추가라는 항목이 있는데 이 추가 버튼을 눌러서 메모장에서 작성하여
저장한 test.xml 파일을 읽어 옵니다.
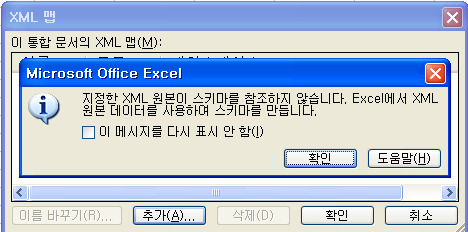
파일을 읽어오면 위와 같은 팝업창이 뜨는데 그냥 확인 하시면 됩니다.
메모장에서 작성 할 경우에는 스키마 형식이 저장이 안되기 때문에 그냥 확인 하셔도
자동으로 엑셀에서 생성을 해 줍니다. (다른 방법에서는 스키마 형식의 파일도 추출이 가능합니다.)
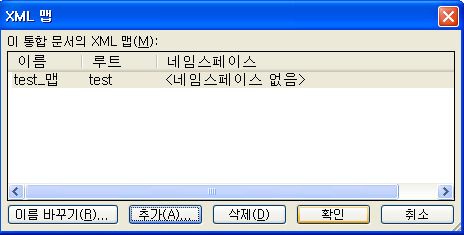
확인을 하고 나면 위 화면처럼 test_맵이라는 맵핑 요소가 생성 됐음을 알 수 있습니다.
그리고 확인을 누르게 되면 아래 그림과 같이 맵핑 요소가 생성 됐음을 알 수 있습니다.
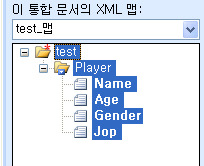
맵핑 요소를 보시면 맨 위에 test 부분을 클릭하게 되면 하위 카테고리들이 한번에 지정이 됩니다.
그리고 test 글자 부분을 마우스로 드래그 하시면 맵핑 요소가 딸려 나오는걸 볼 수 있게 됩니다.
그리고 실제 자신이 출력 할 필드에 드랍을 하면 아래와 같이 맵핑이 완성이 되겠습니다.
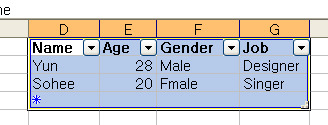
맵핑을 한번 한 뒤에는 각 필드(속성)에 대한 값들은 추가가 가능합니다.
만약 필드(속성)을 추가 해야 할 경우에는 덮었던 맵핑 요소를 제거하고 맨위에 메모장 작성부터...
한번 하실때 잘 하셔야.. 합니다 그래야 노가다를 덜합니다 -_-;;
자 그럼 맵핑도 됐겠다 xml로 출력을 하도록 하겠습니다.
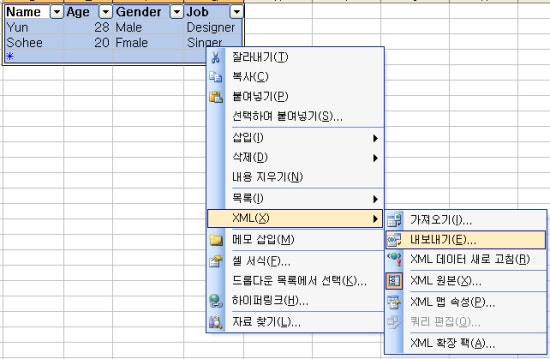
맵핑된 영역에 마우스를 갖다댄 뒤 마우스 우측 버튼을 눌러 메뉴를 출력 시킵니다.
그리고 xml>내보내기 버튼을 클릭 합니다.
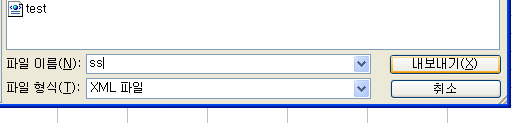
내보내기를 누르게 되면 이제 저장할 xml의 파일명을 작성하면 됩니다.
파일명을 작성 한뒤 내보내기를 하게 되면 실제 사용 될 xml 파일이 완성이 됩니다.
아래는 출력한 xml의 내용입니다..
-----------------------------------------------------------
<?xml version="1.0" encoding="UTF-8" standalone="yes" ?>
- <test xmlns:xsi="http://www.w3.org/2001/XMLSchema-instance"> -----------------------------------------------------------
간단한? 방법으로 엑셀 데이터 시트를 xml로 출력 하는 방법에 대한 설명을 마치겠습니다.
[출처] 엑셀 데이터 시트를 xml로 출력 하기 -1(메모장 활용)|작성자 허수아비


 ExcelListToXml_files.zip
 Is your email address OK? You are signed up for our newsletters but your email address is either unconfirmed, or has not been reconfirmed in a long time. Please click here to have a confirmation email sent so we can confirm your email address and start sending you newsletters again. Alternatively, you can update your subscriptions.